


Apache Beam Mobile Gaming Pipeline Examples
This section provides a walkthrough of a series of example Apache Beam pipelines that demonstrate more complex functionality than the basic WordCount examples. The pipelines in this section process data from a hypothetical game that users play on their mobile phones. The pipelines demonstrate processing at increasing levels of complexity; the first pipeline, for example, shows how to run a batch analysis job to obtain relatively simple score data, while the later pipelines use Beam’s windowing and triggers features to provide low-latency data analysis and more complex intelligence about user’s play patterns.
Note: These examples assume some familiarity with the Beam programming model. If you haven’t already, we recommend familiarizing yourself with the programming model documentation and running a basic example pipeline before continuing. Note also that these examples use the Java 8 lambda syntax, and thus require Java 8. However, you can create pipelines with equivalent functionality using Java 7.
Note: These examples assume some familiarity with the Beam programming model. If you haven’t already, we recommend familiarizing yourself with the programming model documentation and running a basic example pipeline before continuing.
Note: MobileGaming is not yet available for the Go SDK. There is an open issue for this (Issue 18806).
Every time a user plays an instance of our hypothetical mobile game, they generate a data event. Each data event consists of the following information:
- The unique ID of the user playing the game.
- The team ID for the team to which the user belongs.
- A score value for that particular instance of play.
- A timestamp that records when the particular instance of play happened–this is the event time for each game data event.
When the user completes an instance of the game, their phone sends the data event to a game server, where the data is logged and stored in a file. Generally the data is sent to the game server immediately upon completion. However, sometimes delays can happen in the network at various points. Another possible scenario involves users who play the game “offline”, when their phones are out of contact with the server (such as on an airplane, or outside network coverage area). When the user’s phone comes back into contact with the game server, the phone will send all accumulated game data. In these cases, some data events may arrive delayed and out of order.
The following diagram shows the ideal situation (events are processed as they occur) vs. reality (there is often a time delay before processing).
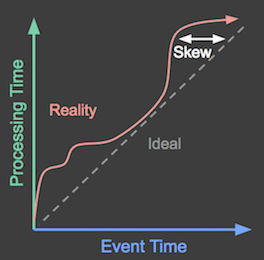
Figure 1: The X-axis represents event time: the actual time a game event occurred. The Y-axis represents processing time: the time at which a game event was processed. Ideally, events should be processed as they occur, depicted by the dotted line in the diagram. However, in reality that is not the case and it looks more like what is depicted by the red squiggly line above the ideal line.
The data events might be received by the game server significantly later than users generate them. This time difference (called skew) can have processing implications for pipelines that make calculations that consider when each score was generated. Such pipelines might track scores generated during each hour of a day, for example, or they calculate the length of time that users are continuously playing the game—both of which depend on each data record’s event time.
Because some of our example pipelines use data files (like logs from the game server) as input, the event timestamp for each game might be embedded in the data–that is, it’s a field in each data record. Those pipelines need to parse the event timestamp from each data record after reading it from the input file.
For pipelines that read unbounded game data from an unbounded source, the data source sets the intrinsic timestamp for each PCollection element to the appropriate event time.
The Mobile Gaming example pipelines vary in complexity, from simple batch analysis to more complex pipelines that can perform real-time analysis and abuse detection. This section walks you through each example and demonstrates how to use Beam features like windowing and triggers to expand your pipeline’s capabilites.
UserScore: Basic Score Processing in Batch
The UserScore pipeline is the simplest example for processing mobile game data. UserScore determines the total score per user over a finite data set (for example, one day’s worth of scores stored on the game server). Pipelines like UserScore are best run periodically after all relevant data has been gathered. For example, UserScore could run as a nightly job over data gathered during that day.
Note: See UserScore on GitHub for the complete example pipeline program.
Note: See UserScore on GitHub for the complete example pipeline program.
What Does UserScore Do?
In a day’s worth of scoring data, each user ID may have multiple records (if the user plays more than one instance of the game during the analysis window), each with their own score value and timestamp. If we want to determine the total score over all the instances a user plays during the day, our pipeline will need to group all the records together per individual user.
As the pipeline processes each event, the event score gets added to the sum total for that particular user.
UserScore parses out only the data that it needs from each record, specifically the user ID and the score value. The pipeline doesn’t consider the event time for any record; it simply processes all data present in the input files that you specify when you run the pipeline.
Note: To use the
UserScorepipeline effectively, you’d need to ensure that you supply input data that has already been grouped by the desired event time period — that is, that you specify an input file that only contains data from the day you care about.
UserScore’s basic pipeline flow does the following:
- Read the day’s score data from a text file.
- Sum the score values for each unique user by grouping each game event by user ID and combining the score values to get the total score for that particular user.
- Write the result data to a text file.
The following diagram shows score data for several users over the pipeline analysis period. In the diagram, each data point is an event that results in one user/score pair.
Figure 2: Score data for three users.
This example uses batch processing, and the diagram’s Y axis represents processing time: the pipeline processes events lower on the Y-axis first, and events higher up the axis later. The diagram’s X axis represents the event time for each game event, as denoted by that event’s timestamp. Note that the individual events in the diagram are not processed by the pipeline in the same order as they occurred (according to their timestamps).
After reading the score events from the input file, the pipeline groups all of those user/score pairs together and sums the score values into one total value per unique user. UserScore encapsulates the core logic for that step as the user-defined composite transform ExtractAndSumScore:
public static class ExtractAndSumScore
    extends PTransform<PCollection<GameActionInfo>, PCollection<KV<String, Integer>>> {

  private final String field;

  ExtractAndSumScore(String field) {
    this.field = field;
  }

  @Override
  public PCollection<KV<String, Integer>> expand(PCollection<GameActionInfo> gameInfo) {

    return gameInfo
        .apply(
            MapElements.into(
                    TypeDescriptors.kvs(TypeDescriptors.strings(), TypeDescriptors.integers()))
                .via((GameActionInfo gInfo) -> KV.of(gInfo.getKey(field), gInfo.getScore())))
        .apply(Sum.integersPerKey());
  }
}
class ExtractAndSumScore(beam.PTransform):
"""A transform to extract key/score information and sum the scores.
The constructor argument `field` determines whether 'team' or 'user' info is
extracted.
"""
def __init__(self, field):
# TODO(BEAM-6158): Revert the workaround once we can pickle super() on py3.
# super().__init__()
beam.PTransform.__init__(self)
self.field = field
def expand(self, pcoll):
return (
pcoll
| beam.Map(lambda elem: (elem[self.field], elem['score']))
| beam.CombinePerKey(sum))ExtractAndSumScore is written to be more general, in that you can pass in the field by which you want to group the data (in the case of our game, by unique user or unique team). This means we can re-use ExtractAndSumScore in other pipelines that group score data by team, for example.
Here’s the main method of UserScore, showing how we apply all three steps of the pipeline:
public static void main(String[] args) throws Exception {
  // Begin constructing a pipeline configured by commandline flags.
  Options options = PipelineOptionsFactory.fromArgs(args).withValidation().as(Options.class);
  Pipeline pipeline = Pipeline.create(options);

  // Read events from a text file and parse them.
  pipeline
      .apply(TextIO.read().from(options.getInput()))
      .apply("ParseGameEvent", ParDo.of(new ParseEventFn()))
      // Extract and sum username/score pairs from the event data.
      .apply("ExtractUserScore", new ExtractAndSumScore("user"))
      .apply(
          "WriteUserScoreSums", new WriteToText<>(options.getOutput(), configureOutput(), false));

  // Run the batch pipeline.
  pipeline.run().waitUntilFinish();
}
def run(argv=None, save_main_session=True):
"""Main entry point; defines and runs the user_score pipeline."""
parser = argparse.ArgumentParser()
# The default maps to two large Google Cloud Storage files (each ~12GB)
# holding two subsequent day's worth (roughly) of data.
parser.add_argument(
'--input',
type=str,
default='gs://apache-beam-samples/game/small/gaming_data.csv',
help='Path to the data file(s) containing game data.')
parser.add_argument(
'--output', type=str, required=True, help='Path to the output file(s).')
args, pipeline_args = parser.parse_known_args(argv)
options = PipelineOptions(pipeline_args)
# We use the save_main_session option because one or more DoFn's in this
# workflow rely on global context (e.g., a module imported at module level).
options.view_as(SetupOptions).save_main_session = save_main_session
with beam.Pipeline(options=options) as p:
def format_user_score_sums(user_score):
(user, score) = user_score
return 'user: %s, total_score: %s' % (user, score)
( # pylint: disable=expression-not-assigned
p
| 'ReadInputText' >> beam.io.ReadFromText(args.input)
| 'UserScore' >> UserScore()
| 'FormatUserScoreSums' >> beam.Map(format_user_score_sums)
| 'WriteUserScoreSums' >> beam.io.WriteToText(args.output))Limitations
As written in the example, the UserScore pipeline has a few limitations:
Because some score data may be generated by offline players and sent after the daily cutoff, for game data, the result data generated by the
UserScorepipeline may be incomplete.UserScoreonly processes the fixed input set present in the input file(s) when the pipeline runs.UserScoreprocesses all data events present in the input file at processing time, and does not examine or otherwise error-check events based on event time. Therefore, the results may include some values whose event times fall outside the relevant analysis period, such as late records from the previous day.Because
UserScoreruns only after all the data has been collected, it has high latency between when users generate data events (the event time) and when results are computed (the processing time).UserScorealso only reports the total results for the entire day, and doesn’t provide any finer-grained information about how the data accumulated during the day.
Starting with the next pipeline example, we’ll discuss how you can use Beam’s features to address these limitations.
HourlyTeamScore: Advanced Processing in Batch with Windowing
The HourlyTeamScore pipeline expands on the basic batch analysis principles used in the UserScore pipeline and improves upon some of its limitations. HourlyTeamScore performs finer-grained analysis, both by using additional features in the Beam SDKs, and taking into account more aspects of the game data. For example, HourlyTeamScore can filter out data that isn’t part of the relevant analysis period.
Like UserScore, HourlyTeamScore is best thought of as a job to be run periodically after all the relevant data has been gathered (such as once per day). The pipeline reads a fixed data set from a file, and writes the results back to a text fileto a Google Cloud BigQuery table.
Note: See HourlyTeamScore on GitHub for the complete example pipeline program.
Note: See HourlyTeamScore on GitHub for the complete example pipeline program.
What Does HourlyTeamScore Do?
HourlyTeamScore calculates the total score per team, per hour, in a fixed data set (such as one day’s worth of data).
Rather than operating on the entire data set at once,
HourlyTeamScoredivides the input data into logical windows and performs calculations on those windows. This allowsHourlyUserScoreto provide information on scoring data per window, where each window represents the game score progress at fixed intervals in time (like once every hour).HourlyTeamScorefilters data events based on whether their event time (as indicated by the embedded timestamp) falls within the relevant analysis period. Basically, the pipeline checks each game event’s timestamp and ensures that it falls within the range we want to analyze (in this case the day in question). Data events from previous days are discarded and not included in the score totals. This makesHourlyTeamScoremore robust and less prone to erroneous result data thanUserScore. It also allows the pipeline to account for late-arriving data that has a timestamp within the relevant analysis period.
Below, we’ll look at each of these enhancements in HourlyTeamScore in detail:
Fixed-Time Windowing
Using fixed-time windowing lets the pipeline provide better information on how events accumulated in the data set over the course of the analysis period. In our case, it tells us when in the day each team was active and how much the team scored at those times.
The following diagram shows how the pipeline processes a day’s worth of a single team’s scoring data after applying fixed-time windowing:
Figure 3: Score data for two teams. Each team’s scores are divided into logical windows based on when those scores occurred in event time.
Notice that as processing time advances, the sums are now per window; each window represents an hour of event time during the day in which the scores occurred.
Note: As is shown in the diagram above, using windowing produces an independent total for every interval (in this case, each hour).
HourlyTeamScoredoesn’t provide a running total for the entire data set at each hour–it provides the total score for all the events that occurred only within that hour.
Beam’s windowing feature uses the intrinsic timestamp information attached to each element of a PCollection. Because we want our pipeline to window based on event time, we must first extract the timestamp that’s embedded in each data record apply it to the corresponding element in the PCollection of score data. Then, the pipeline can apply the windowing function to divide the PCollection into logical windows.
HourlyTeamScore uses the WithTimestamps and Window transforms to perform these operations.
HourlyTeamScore uses the FixedWindows transform, found in window.py, to perform these operations.
The following code shows this:
// Add an element timestamp based on the event log, and apply fixed windowing.
.apply(
    "AddEventTimestamps",
    WithTimestamps.of((GameActionInfo i) -> new Instant(i.getTimestamp())))
.apply(
    "FixedWindowsTeam",
    Window.into(FixedWindows.of(Duration.standardMinutes(options.getWindowDuration()))))
# Add an element timestamp based on the event log, and apply fixed
# windowing.
| 'AddEventTimestamps' >> beam.Map(
lambda elem: beam.window.TimestampedValue(elem, elem['timestamp']))
| 'FixedWindowsTeam' >> beam.WindowInto(
beam.window.FixedWindows(self.window_duration_in_seconds))Notice that the transforms the pipeline uses to specify the windowing are distinct from the actual data processing transforms (such as ExtractAndSumScores). This functionality provides you some flexibility in designing your Beam pipeline, in that you can run existing transforms over datasets with different windowing characteristics.
Filtering Based On Event Time
HourlyTeamScore uses filtering to remove any events from our dataset whose timestamps don’t fall within the relevant analysis period (i.e. they weren’t generated during the day that we’re interested in). This keeps the pipeline from erroneously including any data that was, for example, generated offline during the previous day but sent to the game server during the current day.
It also lets the pipeline include relevant late data—data events with valid timestamps, but that arrived after our analysis period ended. If our pipeline cutoff time is 12:00 am, for example, we might run the pipeline at 2:00 am, but filter out any events whose timestamps indicate that they occurred after the 12:00 am cutoff. Data events that were delayed and arrived between 12:01 am and 2:00 am, but whose timestamps indicate that they occurred before the 12:00 am cutoff, would be included in the pipeline processing.
HourlyTeamScore uses the Filter transform to perform this operation. When you apply Filter, you specify a predicate to which each data record is compared. Data records that pass the comparison are included, while events that fail the comparison are excluded. In our case, the predicate is the cut-off time we specify, and we compare just one part of the data—the timestamp field.
The following code shows how HourlyTeamScore uses the Filter transform to filter events that occur either before or after the relevant analysis period:
.apply(
"FilterStartTime",
Filter.by(
(GameActionInfo gInfo) -> gInfo.getTimestamp() > startMinTimestamp.getMillis()))
.apply(
"FilterEndTime",
Filter.by(
(GameActionInfo gInfo) -> gInfo.getTimestamp() < stopMinTimestamp.getMillis()))| 'FilterStartTime' >>
beam.Filter(lambda elem: elem['timestamp'] > self.start_timestamp)
| 'FilterEndTime' >>
beam.Filter(lambda elem: elem['timestamp'] < self.stop_timestamp)Calculating Score Per Team, Per Window
HourlyTeamScore uses the same ExtractAndSumScores transform as the UserScore pipeline, but passes a different key (team, as opposed to user). Also, because the pipeline applies ExtractAndSumScores after applying fixed-time 1-hour windowing to the input data, the data gets grouped by both team and window. You can see the full sequence of transforms in HourlyTeamScore’s main method:
public static void main(String[] args) throws Exception {
// Begin constructing a pipeline configured by commandline flags.
Options options = PipelineOptionsFactory.fromArgs(args).withValidation().as(Options.class);
Pipeline pipeline = Pipeline.create(options);
final Instant stopMinTimestamp = new Instant(minFmt.parseMillis(options.getStopMin()));
final Instant startMinTimestamp = new Instant(minFmt.parseMillis(options.getStartMin()));
// Read 'gaming' events from a text file.
pipeline
.apply(TextIO.read().from(options.getInput()))
// Parse the incoming data.
.apply("ParseGameEvent", ParDo.of(new ParseEventFn()))
// Filter out data before and after the given times so that it is not included
// in the calculations. As we collect data in batches (say, by day), the batch for the day
// that we want to analyze could potentially include some late-arriving data from the
// previous day.
// If so, we want to weed it out. Similarly, if we include data from the following day
// (to scoop up late-arriving events from the day we're analyzing), we need to weed out
// events that fall after the time period we want to analyze.
// [START DocInclude_HTSFilters]
.apply(
"FilterStartTime",
Filter.by(
(GameActionInfo gInfo) -> gInfo.getTimestamp() > startMinTimestamp.getMillis()))
.apply(
"FilterEndTime",
Filter.by(
(GameActionInfo gInfo) -> gInfo.getTimestamp() < stopMinTimestamp.getMillis()))
// [END DocInclude_HTSFilters]
// [START DocInclude_HTSAddTsAndWindow]
// Add an element timestamp based on the event log, and apply fixed windowing.
.apply(
"AddEventTimestamps",
WithTimestamps.of((GameActionInfo i) -> new Instant(i.getTimestamp())))
.apply(
"FixedWindowsTeam",
Window.into(FixedWindows.of(Duration.standardMinutes(options.getWindowDuration()))))
// [END DocInclude_HTSAddTsAndWindow]
// Extract and sum teamname/score pairs from the event data.
.apply("ExtractTeamScore", new ExtractAndSumScore("team"))
.apply(
"WriteTeamScoreSums", new WriteToText<>(options.getOutput(), configureOutput(), true));
pipeline.run().waitUntilFinish();
}class HourlyTeamScore(beam.PTransform):
def __init__(self, start_min, stop_min, window_duration):
# TODO(BEAM-6158): Revert the workaround once we can pickle super() on py3.
# super().__init__()
beam.PTransform.__init__(self)
self.start_timestamp = str2timestamp(start_min)
self.stop_timestamp = str2timestamp(stop_min)
self.window_duration_in_seconds = window_duration * 60
def expand(self, pcoll):
return (
pcoll
| 'ParseGameEventFn' >> beam.ParDo(ParseGameEventFn())
# Filter out data before and after the given times so that it is not
# included in the calculations. As we collect data in batches (say, by
# day), the batch for the day that we want to analyze could potentially
# include some late-arriving data from the previous day. If so, we want
# to weed it out. Similarly, if we include data from the following day
# (to scoop up late-arriving events from the day we're analyzing), we
# need to weed out events that fall after the time period we want to
# analyze.
# [START filter_by_time_range]
| 'FilterStartTime' >>
beam.Filter(lambda elem: elem['timestamp'] > self.start_timestamp)
| 'FilterEndTime' >>
beam.Filter(lambda elem: elem['timestamp'] < self.stop_timestamp)
# [END filter_by_time_range]
# [START add_timestamp_and_window]
# Add an element timestamp based on the event log, and apply fixed
# windowing.
| 'AddEventTimestamps' >> beam.Map(
    lambda elem: beam.window.TimestampedValue(elem, elem['timestamp']))
| 'FixedWindowsTeam' >> beam.WindowInto(
    beam.window.FixedWindows(self.window_duration_in_seconds))
# [END add_timestamp_and_window]
# Extract and sum teamname/score pairs from the event data.
| 'ExtractAndSumScore' >> ExtractAndSumScore('team'))
def run(argv=None, save_main_session=True):
"""Main entry point; defines and runs the hourly_team_score pipeline."""
parser = argparse.ArgumentParser()
# The default maps to two large Google Cloud Storage files (each ~12GB)
# holding two subsequent day's worth (roughly) of data.
parser.add_argument(
'--input',
type=str,
default='gs://apache-beam-samples/game/gaming_data*.csv',
help='Path to the data file(s) containing game data.')
parser.add_argument(
'--dataset',
type=str,
required=True,
help='BigQuery Dataset to write tables to. '
'Must already exist.')
parser.add_argument(
'--table_name',
default='leader_board',
help='The BigQuery table name. Should not already exist.')
parser.add_argument(
'--window_duration',
type=int,
default=60,
help='Numeric value of fixed window duration, in minutes')
parser.add_argument(
'--start_min',
type=str,
default='1970-01-01-00-00',
help='String representation of the first minute after '
'which to generate results in the format: '
'yyyy-MM-dd-HH-mm. Any input data timestamped '
'prior to that minute won\'t be included in the '
'sums.')
parser.add_argument(
'--stop_min',
type=str,
default='2100-01-01-00-00',
help='String representation of the first minute for '
'which to generate results in the format: '
'yyyy-MM-dd-HH-mm. Any input data timestamped '
'after to that minute won\'t be included in the '
'sums.')
args, pipeline_args = parser.parse_known_args(argv)
options = PipelineOptions(pipeline_args)
# We also require the --project option to access --dataset
if options.view_as(GoogleCloudOptions).project is None:
parser.print_usage()
print(sys.argv[0] + ': error: argument --project is required')
sys.exit(1)
# We use the save_main_session option because one or more DoFn's in this
# workflow rely on global context (e.g., a module imported at module level).
options.view_as(SetupOptions).save_main_session = save_main_session
with beam.Pipeline(options=options) as p:
( # pylint: disable=expression-not-assigned
p
| 'ReadInputText' >> beam.io.ReadFromText(args.input)
| 'HourlyTeamScore' >> HourlyTeamScore(
args.start_min, args.stop_min, args.window_duration)
| 'TeamScoresDict' >> beam.ParDo(TeamScoresDict())
| 'WriteTeamScoreSums' >> WriteToBigQuery(
args.table_name,
args.dataset,
{
'team': 'STRING',
'total_score': 'INTEGER',
'window_start': 'STRING',
},
options.view_as(GoogleCloudOptions).project))Limitations
As written, HourlyTeamScore still has a limitation:
HourlyTeamScorestill has high latency between when data events occur (the event time) and when results are generated (the processing time), because, as a batch pipeline, it needs to wait to begin processing until all data events are present.
LeaderBoard: Streaming Processing with Real-Time Game Data
One way we can help address the latency issue present in the UserScore and HourlyTeamScore pipelines is by reading the score data from an unbounded source. The LeaderBoard pipeline introduces streaming processing by reading the game score data from an unbounded source that produces an infinite amount of data, rather than from a file on the game server.
The LeaderBoard pipeline also demonstrates how to process game score data with respect to both processing time and event time. LeaderBoard outputs data about both individual user scores and about team scores, each with respect to a different time frame.
Because the LeaderBoard pipeline reads the game data from an unbounded source as that data is generated, you can think of the pipeline as an ongoing job running concurrently with the game process. LeaderBoard can thus provide low-latency insights into how users are playing the game at any given moment — useful if, for example, we want to provide a live web-based scoreboard so that users can track their progress against other users as they play.
Note: See LeaderBoard on GitHub for the complete example pipeline program.
Note: See LeaderBoard on GitHub for the complete example pipeline program.
What Does LeaderBoard Do?
The LeaderBoard pipeline reads game data published to an unbounded source that produces an infinite amount of data in near real-time, and uses that data to perform two separate processing tasks:
LeaderBoardcalculates the total score for every unique user and publishes speculative results for every ten minutes of processing time. That is, ten minutes after data is received, the pipeline outputs the total score per user that the pipeline has processed to date. This calculation provides a running “leader board” in close to real time, regardless of when the actual game events were generated.LeaderBoardcalculates the team scores for each hour that the pipeline runs. This is useful if we want to, for example, reward the top-scoring team for each hour of play. The team score calculation uses fixed-time windowing to divide the input data into hour-long finite windows based on the event time (indicated by the timestamp) as data arrives in the pipeline.In addition, the team score calculation uses Beam’s trigger mechanisms to provide speculative results for each hour (which update every five minutes until the hour is up), and to also capture any late data and add it to the specific hour-long window to which it belongs.
Below, we’ll look at both of these tasks in detail.
Calculating User Score based on Processing Time
We want our pipeline to output a running total score for each user for every ten minutes of processing time. This calculation doesn’t consider when the actual score was generated by the user’s play instance; it simply outputs the sum of all the scores for that user that have arrived in the pipeline to date. Late data gets included in the calculation whenever it happens to arrive in the pipeline as it’s running.
Because we want all the data that has arrived in the pipeline every time we update our calculation, we have the pipeline consider all of the user score data in a single global window. The single global window is unbounded, but we can specify a kind of temporary cut-off point for each ten-minute calculation by using a processing time trigger.
When we specify a ten-minute processing time trigger for the single global window, the pipeline effectively takes a “snapshot” of the contents of the window every time the trigger fires. This snapshot happens after ten minutes have passed since data was received. If no data has arrived, the pipeline takes its next “snapshot” 10 minutes after an element arrives. Since we’re using a single global window, each snapshot contains all the data collected to that point in time. The following diagram shows the effects of using a processing time trigger on the single global window:
Figure 4: Score data for three users. Each user’s scores are grouped together in a single global window, with a trigger that generates a snapshot for output ten minutes after data is received.
As processing time advances and more scores are processed, the trigger outputs the updated sum for each user.
The following code example shows how LeaderBoard sets the processing time trigger to output the data for user scores:
/**
 * Extract user/score pairs from the event stream using processing time, via global windowing. Get
 * periodic updates on all users' running scores.
 */
@VisibleForTesting
static class CalculateUserScores
    extends PTransform<PCollection<GameActionInfo>, PCollection<KV<String, Integer>>> {
  private final Duration allowedLateness;

  CalculateUserScores(Duration allowedLateness) {
    this.allowedLateness = allowedLateness;
  }

  @Override
  public PCollection<KV<String, Integer>> expand(PCollection<GameActionInfo> input) {
    return input
        .apply(
            "LeaderboardUserGlobalWindow",
            Window.<GameActionInfo>into(new GlobalWindows())
                // Get periodic results every ten minutes.
                .triggering(
                    Repeatedly.forever(
                        AfterProcessingTime.pastFirstElementInPane().plusDelayOf(TEN_MINUTES)))
                .accumulatingFiredPanes()
                .withAllowedLateness(allowedLateness))
        // Extract and sum username/score pairs from the event data.
        .apply("ExtractUserScore", new ExtractAndSumScore("user"));
  }
}
class CalculateUserScores(beam.PTransform):
"""Extract user/score pairs from the event stream using processing time, via
global windowing. Get periodic updates on all users' running scores.
"""
def __init__(self, allowed_lateness):
# TODO(BEAM-6158): Revert the workaround once we can pickle super() on py3.
# super().__init__()
beam.PTransform.__init__(self)
self.allowed_lateness_seconds = allowed_lateness * 60
def expand(self, pcoll):
# NOTE: the behavior does not exactly match the Java example
# TODO: allowed_lateness not implemented yet in FixedWindows
# TODO: AfterProcessingTime not implemented yet, replace AfterCount
return (
pcoll
# Get periodic results every ten events.
| 'LeaderboardUserGlobalWindows' >> beam.WindowInto(
beam.window.GlobalWindows(),
trigger=trigger.Repeatedly(trigger.AfterCount(10)),
accumulation_mode=trigger.AccumulationMode.ACCUMULATING)
# Extract and sum username/score pairs from the event data.
| 'ExtractAndSumScore' >> ExtractAndSumScore('user'))LeaderBoard sets the window accumulation mode to accumulate window panes as the trigger fires. This accumulation mode is set by invoking .accumulatingFiredPanes using accumulation_mode=trigger.AccumulationMode.ACCUMULATING when setting the trigger, and causes the pipeline to accumulate the previously emitted data together with any new data that’s arrived since the last trigger fire. This ensures that LeaderBoard is a running sum for the user scores, rather than a collection of individual sums.
Calculating Team Score based on Event Time
We want our pipeline to also output the total score for each team during each hour of play. Unlike the user score calculation, for team scores, we care about when in event time each score actually occurred, because we want to consider each hour of play individually. We also want to provide speculative updates as each individual hour progresses, and to allow any instances of late data — data that arrives after a given hour’s data is considered complete — to be included in our calculation.
Because we consider each hour individually, we can apply fixed-time windowing to our input data, just like in HourlyTeamScore. To provide the speculative updates and updates on late data, we’ll specify additional trigger parameters. The trigger will cause each window to calculate and emit results at an interval we specify (in this case, every five minutes), and also to keep triggering after the window is considered “complete” to account for late data. Just like the user score calculation, we’ll set the trigger to accumulating mode to ensure that we get a running sum for each hour-long window.
The triggers for speculative updates and late data help with the problem of time skew. Events in the pipeline aren’t necessarily processed in the order in which they actually occurred according to their timestamps; they may arrive in the pipeline out of order, or late (in our case, because they were generated while the user’s phone was out of contact with a network). Beam needs a way to determine when it can reasonably assume that it has “all” of the data in a given window: this is called the watermark.
In an ideal world, all data would be processed immediately when it occurs, so the processing time would be equal to (or at least have a linear relationship to) the event time. However, because distributed systems contain some inherent inaccuracy (like our late-reporting phones), Beam often uses a heuristic watermark.
The following diagram shows the relationship between ongoing processing time and each score’s event time for two teams:
Figure 5: Score data by team, windowed by event time. A trigger based on processing time causes the window to emit speculative early results and include late results.
The dotted line in the diagram is the “ideal” watermark: Beam’s notion of when all data in a given window can reasonably be considered to have arrived. The irregular solid line represents the actual watermark, as determined by the data source.
Data arriving above the solid watermark line is late data — this is a score event that was delayed (perhaps generated offline) and arrived after the window to which it belongs had closed. Our pipeline’s late-firing trigger ensures that this late data is still included in the sum.
The following code example shows how LeaderBoard applies fixed-time windowing with the appropriate triggers to have our pipeline perform the calculations we want:
// Extract team/score pairs from the event stream, using hour-long windows by default.
@VisibleForTesting
static class CalculateTeamScores
    extends PTransform<PCollection<GameActionInfo>, PCollection<KV<String, Integer>>> {
  private final Duration teamWindowDuration;
  private final Duration allowedLateness;

  CalculateTeamScores(Duration teamWindowDuration, Duration allowedLateness) {
    this.teamWindowDuration = teamWindowDuration;
    this.allowedLateness = allowedLateness;
  }

  @Override
  public PCollection<KV<String, Integer>> expand(PCollection<GameActionInfo> infos) {
    return infos
        .apply(
            "LeaderboardTeamFixedWindows",
            Window.<GameActionInfo>into(FixedWindows.of(teamWindowDuration))
                // We will get early (speculative) results as well as cumulative
                // processing of late data.
                .triggering(
                    AfterWatermark.pastEndOfWindow()
                        .withEarlyFirings(
                            AfterProcessingTime.pastFirstElementInPane()
                                .plusDelayOf(FIVE_MINUTES))
                        .withLateFirings(
                            AfterProcessingTime.pastFirstElementInPane()
                                .plusDelayOf(TEN_MINUTES)))
                .withAllowedLateness(allowedLateness)
                .accumulatingFiredPanes())
        // Extract and sum teamname/score pairs from the event data.
        .apply("ExtractTeamScore", new ExtractAndSumScore("team"));
  }
}
class CalculateTeamScores(beam.PTransform):
"""Calculates scores for each team within the configured window duration.
Extract team/score pairs from the event stream, using hour-long windows by
default.
"""
def __init__(self, team_window_duration, allowed_lateness):
# TODO(BEAM-6158): Revert the workaround once we can pickle super() on py3.
# super().__init__()
beam.PTransform.__init__(self)
self.team_window_duration = team_window_duration * 60
self.allowed_lateness_seconds = allowed_lateness * 60
def expand(self, pcoll):
# NOTE: the behavior does not exactly match the Java example
# TODO: allowed_lateness not implemented yet in FixedWindows
# TODO: AfterProcessingTime not implemented yet, replace AfterCount
return (
pcoll
# We will get early (speculative) results as well as cumulative
# processing of late data.
| 'LeaderboardTeamFixedWindows' >> beam.WindowInto(
beam.window.FixedWindows(self.team_window_duration),
trigger=trigger.AfterWatermark(
trigger.AfterCount(10), trigger.AfterCount(20)),
accumulation_mode=trigger.AccumulationMode.ACCUMULATING)
# Extract and sum teamname/score pairs from the event data.
| 'ExtractAndSumScore' >> ExtractAndSumScore('team'))Taken together, these processing strategies let us address the latency and completeness issues present in the UserScore and HourlyTeamScore pipelines, while still using the same basic transforms to process the data—as a matter of fact, both calculations still use the same ExtractAndSumScore transform that we used in both the UserScore and HourlyTeamScore pipelines.
GameStats: Abuse Detection and Usage Analysis
While LeaderBoard demonstrates how to use basic windowing and triggers to perform low-latency and flexible data analysis, we can use more advanced windowing techniques to perform more comprehensive analysis. This might include some calculations designed to detect system abuse (like spam) or to gain insight into user behavior. The GameStats pipeline builds on the low-latency functionality in LeaderBoard to demonstrate how you can use Beam to perform this kind of advanced analysis.
Like LeaderBoard, GameStats reads data from an unbounded source. It is best thought of as an ongoing job that provides insight into the game as users play.
Note: See GameStats on GitHub for the complete example pipeline program.
Note: See GameStats on GitHub for the complete example pipeline program.
What Does GameStats Do?
Like LeaderBoard, GameStats calculates the total score per team, per hour. However, the pipeline also performs two kinds of more complex analysis:
GameStatsdoes abuse detection system that performs some simple statistical analysis on the score data to determine which users, if any, might be spammers or bots. It then uses the list of suspected spam/bot users to filter the bots out of the hourly team score calculation.GameStatsanalyzes usage patterns by grouping together game data that share similar event times using session windowing. This lets us gain some intelligence on how long users tend to play, and how game length changes over time.
Below, we’ll look at these features in more detail.
Abuse Detection
Let’s suppose scoring in our game depends on the speed at which a user can “click” on their phone. GameStats’s abuse detection analyzes each user’s score data to detect if a user has an abnormally high “click rate” and thus an abnormally high score. This might indicate that the game is being played by a bot that operates significantly faster than a human could play.
To determine whether or not a score is “abnormally” high, GameStats calculates the average of every score in that fixed-time window, and then checks each individual score against the average score multiplied by an arbitrary weight factor (in our case, 2.5). Thus, any score more than 2.5 times the average is deemed to be the product of spam. The GameStats pipeline tracks a list of “spam” users and filters those users out of the team score calculations for the team leader board.
Since the average depends on the pipeline data, we need to calculate it, and then use that calculated data in a subsequent ParDo transform that filters scores that exceed the weighted value. To do this, we can pass the calculated average to as a side input to the filtering ParDo.
The following code example shows the composite transform that handles abuse detection. The transform uses the Sum.integersPerKey transform to sum all scores per user, and then the Mean.globally transform to determine the average score for all users. Once that’s been calculated (as a PCollectionView singleton), we can pass it to the filtering ParDo using .withSideInputs:
public static class CalculateSpammyUsers
    extends PTransform<PCollection<KV<String, Integer>>, PCollection<KV<String, Integer>>> {
  private static final Logger LOG = LoggerFactory.getLogger(CalculateSpammyUsers.class);
  private static final double SCORE_WEIGHT = 2.5;

  @Override
  public PCollection<KV<String, Integer>> expand(PCollection<KV<String, Integer>> userScores) {

    // Get the sum of scores for each user.
    PCollection<KV<String, Integer>> sumScores =
        userScores.apply("UserSum", Sum.integersPerKey());

    // Extract the score from each element, and use it to find the global mean.
    final PCollectionView<Double> globalMeanScore =
        sumScores.apply(Values.create()).apply(Mean.<Integer>globally().asSingletonView());

    // Filter the user sums using the global mean.
    PCollection<KV<String, Integer>> filtered =
        sumScores.apply(
            "ProcessAndFilter",
            ParDo
                // use the derived mean total score as a side input
                .of(
                    new DoFn<KV<String, Integer>, KV<String, Integer>>() {
                      private final Counter numSpammerUsers =
                          Metrics.counter("main", "SpammerUsers");

                      @ProcessElement
                      public void processElement(ProcessContext c) {
                        Integer score = c.element().getValue();
                        Double gmc = c.sideInput(globalMeanScore);
                        if (score > (gmc * SCORE_WEIGHT)) {
                          LOG.info(
                              "user "
                                  + c.element().getKey()
                                  + " spammer score "
                                  + score
                                  + " with mean "
                                  + gmc);
                          numSpammerUsers.inc();
                          c.output(c.element());
                        }
                      }
                    })
                .withSideInputs(globalMeanScore));
    return filtered;
  }
}
class CalculateSpammyUsers(beam.PTransform):
"""Filter out all but those users with a high clickrate, which we will
consider as 'spammy' users.
We do this by finding the mean total score per user, then using that
information as a side input to filter out all but those user scores that are
larger than (mean * SCORE_WEIGHT).
"""
SCORE_WEIGHT = 2.5
def expand(self, user_scores):
# Get the sum of scores for each user.
sum_scores = (user_scores | 'SumUsersScores' >> beam.CombinePerKey(sum))
# Extract the score from each element, and use it to find the global mean.
global_mean_score = (
sum_scores
| beam.Values()
| beam.CombineGlobally(beam.combiners.MeanCombineFn())\
.as_singleton_view())
# Filter the user sums using the global mean.
filtered = (
sum_scores
# Use the derived mean total score (global_mean_score) as a side input.
| 'ProcessAndFilter' >> beam.Filter(
lambda key_score, global_mean:\
key_score[1] > global_mean * self.SCORE_WEIGHT,
global_mean_score))
return filteredThe abuse-detection transform generates a view of users suspected to be spambots. Later in the pipeline, we use that view to filter out any such users when we calculate the team score per hour, again by using the side input mechanism. The following code example shows where we insert the spam filter, between windowing the scores into fixed windows and extracting the team scores:
// Calculate the total score per team over fixed windows,
// and emit cumulative updates for late data. Uses the side input derived above-- the set of
// suspected robots-- to filter out scores from those users from the sum.
// Write the results to BigQuery.
rawEvents
    .apply(
        "WindowIntoFixedWindows",
        Window.into(
            FixedWindows.of(Duration.standardMinutes(options.getFixedWindowDuration()))))
    // Filter out the detected spammer users, using the side input derived above.
    .apply(
        "FilterOutSpammers",
        ParDo.of(
                new DoFn<GameActionInfo, GameActionInfo>() {
                  @ProcessElement
                  public void processElement(ProcessContext c) {
                    // If the user is not in the spammers Map, output the data element.
                    if (c.sideInput(spammersView).get(c.element().getUser().trim()) == null) {
                      c.output(c.element());
                    }
                  }
                })
            .withSideInputs(spammersView))
    // Extract and sum teamname/score pairs from the event data.
    .apply("ExtractTeamScore", new ExtractAndSumScore("team"))
# Calculate the total score per team over fixed windows, and emit cumulative
# updates for late data. Uses the side input derived above --the set of
# suspected robots-- to filter out scores from those users from the sum.
# Write the results to BigQuery.
( # pylint: disable=expression-not-assigned
raw_events
| 'WindowIntoFixedWindows' >> beam.WindowInto(
beam.window.FixedWindows(fixed_window_duration))
# Filter out the detected spammer users, using the side input derived
# above
| 'FilterOutSpammers' >> beam.Filter(
lambda elem, spammers: elem['user'] not in spammers, spammers_view)
# Extract and sum teamname/score pairs from the event data.
| 'ExtractAndSumScore' >> ExtractAndSumScore('team')Analyzing Usage Patterns
We can gain some insight on when users are playing our game, and for how long, by examining the event times for each game score and grouping scores with similar event times into sessions. GameStats uses Beam’s built-in session windowing function to group user scores into sessions based on the time they occurred.
When you set session windowing, you specify a minimum gap duration between events. All events whose arrival times are closer together than the minimum gap duration are grouped into the same window. Events where the difference in arrival time is greater than the gap are grouped into separate windows. Depending on how we set our minimum gap duration, we can safely assume that scores in the same session window are part of the same (relatively) uninterrupted stretch of play. Scores in a different window indicate that the user stopped playing the game for at least the minimum gap time before returning to it later.
The following diagram shows how data might look when grouped into session windows. Unlike fixed windows, session windows are different for each user and is dependent on each individual user’s play pattern:
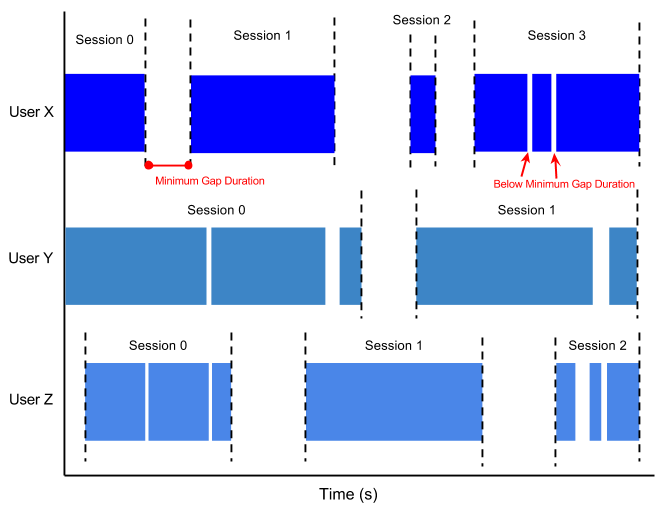
Figure 6: User sessions with a minimum gap duration. Each user has different sessions, according to how many instances they play and how long their breaks between instances are.
We can use the session-windowed data to determine the average length of uninterrupted play time for all of our users, as well as the total score they achieve during each session. We can do this in the code by first applying session windows, summing the score per user and session, and then using a transform to calculate the length of each individual session:
// Detect user sessions-- that is, a burst of activity separated by a gap from further
// activity. Find and record the mean session lengths.
// This information could help the game designers track the changing user engagement
// as their set of games changes.
userEvents
    .apply(
        "WindowIntoSessions",
        Window.<KV<String, Integer>>into(
                Sessions.withGapDuration(Duration.standardMinutes(options.getSessionGap())))
            .withTimestampCombiner(TimestampCombiner.END_OF_WINDOW))
    // For this use, we care only about the existence of the session, not any particular
    // information aggregated over it, so the following is an efficient way to do that.
    .apply(Combine.perKey(x -> 0))
    // Get the duration per session.
    .apply("UserSessionActivity", ParDo.of(new UserSessionInfoFn()))
# Detect user sessions-- that is, a burst of activity separated by a gap
# from further activity. Find and record the mean session lengths.
# This information could help the game designers track the changing user
# engagement as their set of game changes.
( # pylint: disable=expression-not-assigned
user_events
| 'WindowIntoSessions' >> beam.WindowInto(
beam.window.Sessions(session_gap),
timestamp_combiner=beam.window.TimestampCombiner.OUTPUT_AT_EOW)
# For this use, we care only about the existence of the session, not any
# particular information aggregated over it, so we can just group by key
# and assign a "dummy value" of None.
| beam.CombinePerKey(lambda _: None)
# Get the duration of the session
| 'UserSessionActivity' >> beam.ParDo(UserSessionActivity())This gives us a set of user sessions, each with an attached duration. We can then calculate the average session length by re-windowing the data into fixed time windows, and then calculating the average for all sessions that end in each hour:
// Re-window to process groups of session sums according to when the sessions complete.
.apply(
    "WindowToExtractSessionMean",
    Window.into(
        FixedWindows.of(Duration.standardMinutes(options.getUserActivityWindowDuration()))))
// Find the mean session duration in each window.
.apply(Mean.<Integer>globally().withoutDefaults())
// Write this info to a BigQuery table.
.apply(
    "WriteAvgSessionLength",
    new WriteWindowedToBigQuery<>(
        options.as(GcpOptions.class).getProject(),
        options.getDataset(),
        options.getGameStatsTablePrefix() + "_sessions",
        configureSessionWindowWrite()));
# Re-window to process groups of session sums according to when the
# sessions complete
| 'WindowToExtractSessionMean' >> beam.WindowInto(
beam.window.FixedWindows(user_activity_window_duration))
# Find the mean session duration in each window
| beam.CombineGlobally(
beam.combiners.MeanCombineFn()).without_defaults()
| 'FormatAvgSessionLength' >>
beam.Map(lambda elem: {'mean_duration': float(elem)})
| 'WriteAvgSessionLength' >> WriteToBigQuery(
args.table_name + '_sessions',
args.dataset, {
'mean_duration': 'FLOAT',
},
options.view_as(GoogleCloudOptions).project))We can use the resulting information to find, for example, what times of day our users are playing the longest, or which stretches of the day are more likely to see shorter play sessions.
Next Steps
- Take a self-paced tour through our Learning Resources.
- Dive in to some of our favorite Videos and Podcasts.
- Join the Beam users@ mailing list.
Please don’t hesitate to reach out if you encounter any issues!
Last updated on 2026/02/07
Have you found everything you were looking for?
Was it all useful and clear? Is there anything that you would like to change? Let us know!