


BigQuery Performance
The following graphs show various metrics when reading from and writing to BigQuery. See the glossary for definitions.
Read
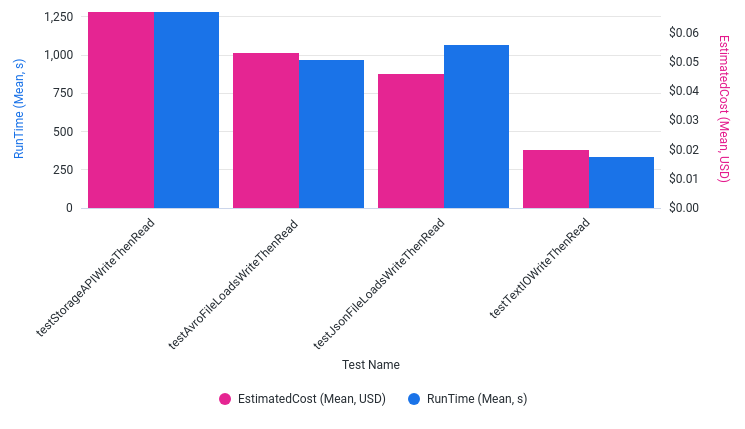
What is the estimated cost to read from BigQuery?
Runtime and Estimated Cost by Test Name
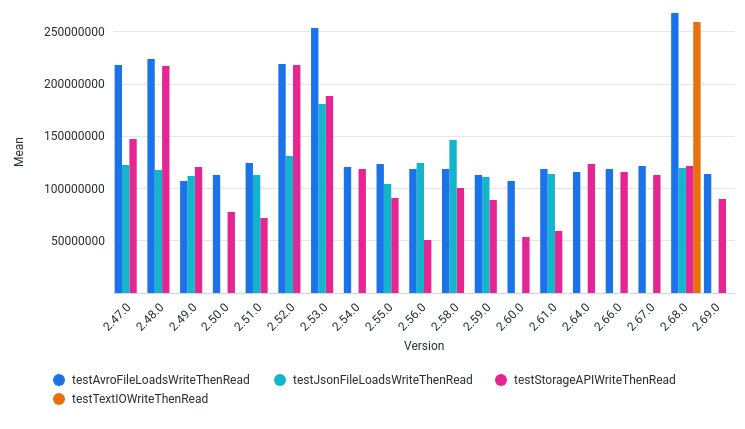
How has various metrics changed when reading from BigQuery for different Beam SDK versions?
AvgOutputThroughputBytesPerSec by Version
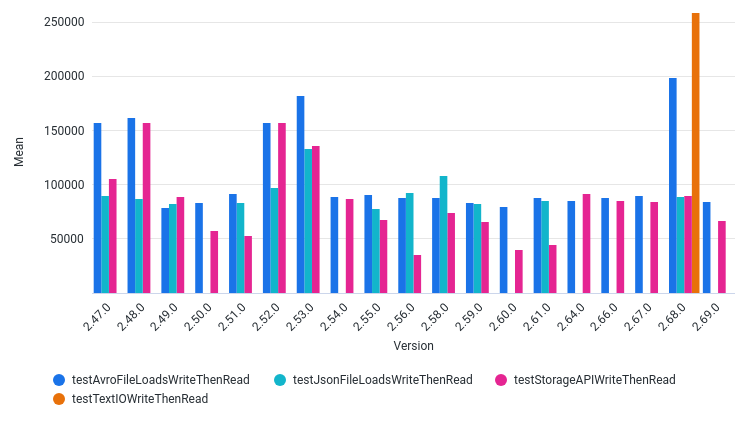
AvgOutputThroughputElementsPerSec by Version
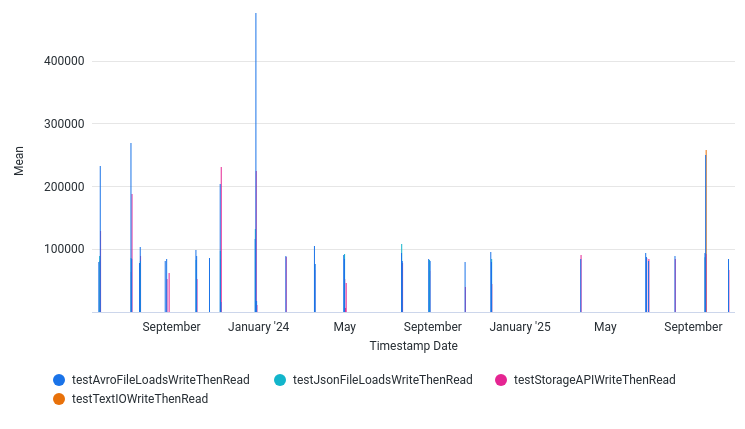
How has various metrics changed over time when reading from BigQuery?
AvgOutputThroughputBytesPerSec by Date
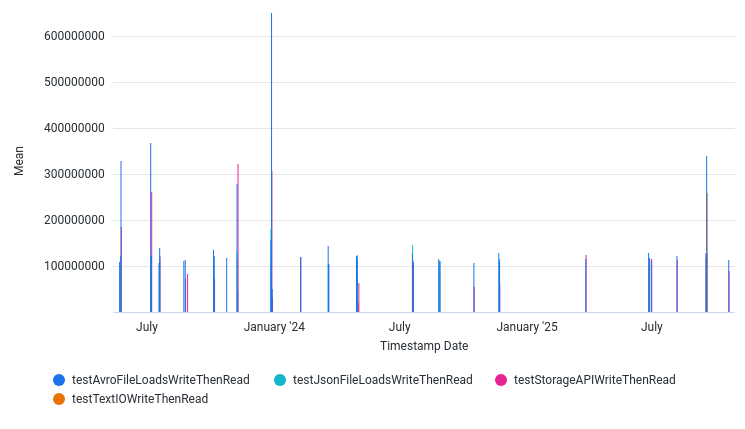
AvgOutputThroughputElementsPerSec by Date
Write
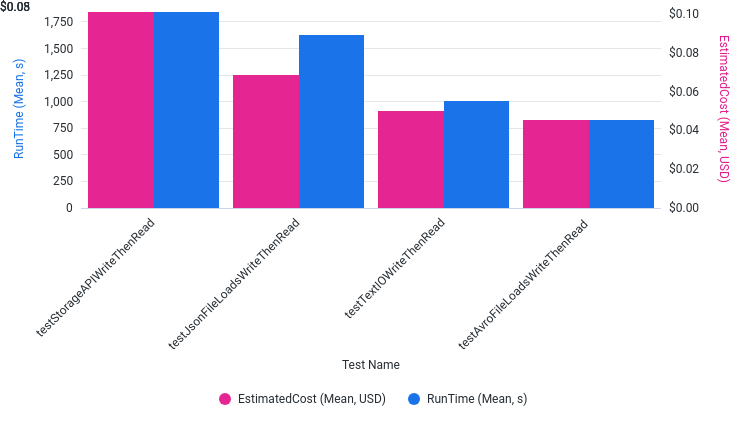
What is the estimated cost to write to BigQuery?
Write BigQuery RunTime and EstimatedCost
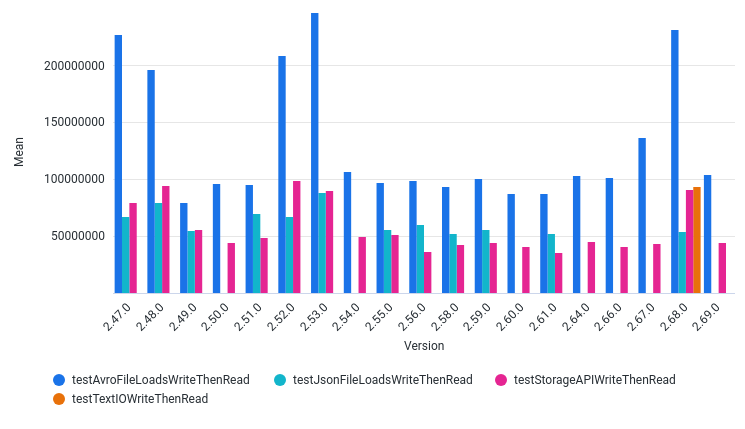
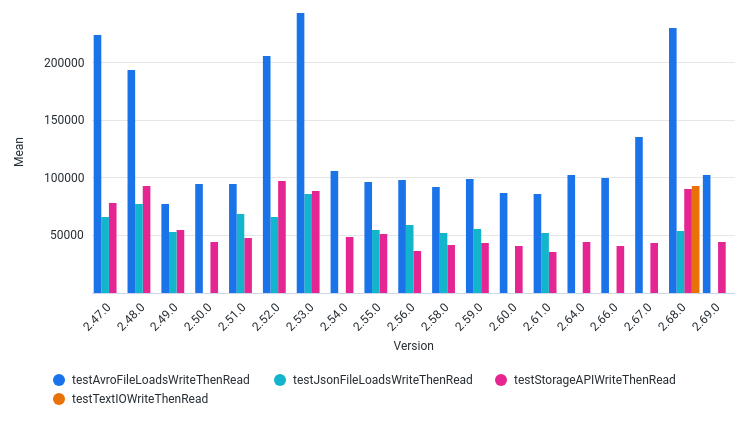
How has various metrics changed when writing to BigQuery for different Beam SDK versions?
AvgInputThroughputBytesPerSec by Version
AvgInputThroughputElementsPerSec by Version
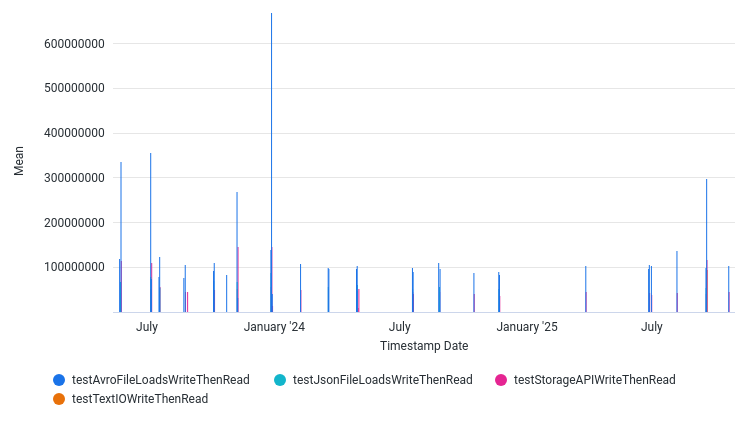
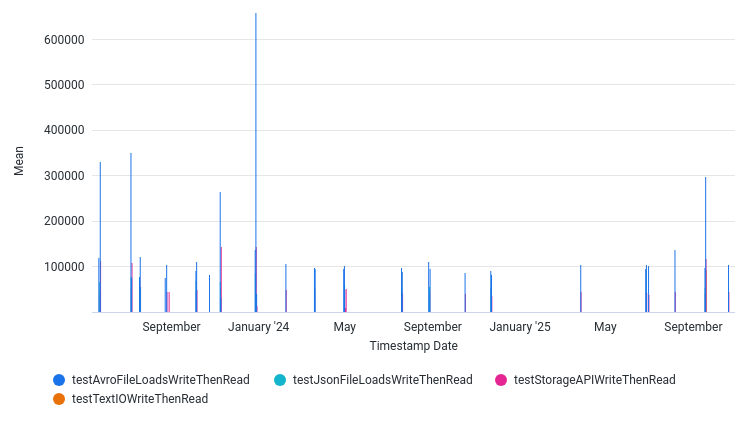
How has various metrics changed over time when writing to BigQuery?
AvgInputThroughputBytesPerSec by Date
AvgInputThroughputElementsPerSec by Date
Last updated on 2026/07/24
Have you found everything you were looking for?
Was it all useful and clear? Is there anything that you would like to change? Let us know!