


TensorFlow MNIST Image Classification Performance
Model: TensorFlow Image Classification — MNIST Accelerator: CPU only Host: 1 × n1-standard-2 (2 vCPUs, 7.5 GB RAM)
The following graphs show performance metrics for a lightweight MNIST digit classification pipeline using TensorFlow and Apache Beam in batch mode. This benchmark is primarily used to validate pipeline correctness and estimate minimal inference cost. See the glossary for definitions.
Full pipeline implementation is available here.
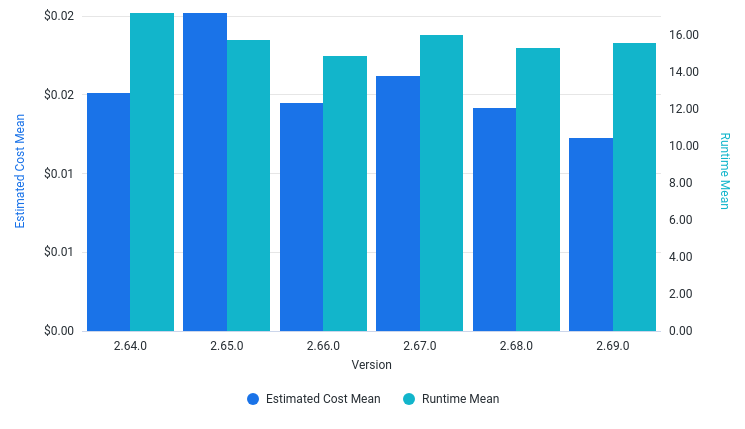
What is the estimated cost to run the pipeline?
RunTime and EstimatedCost
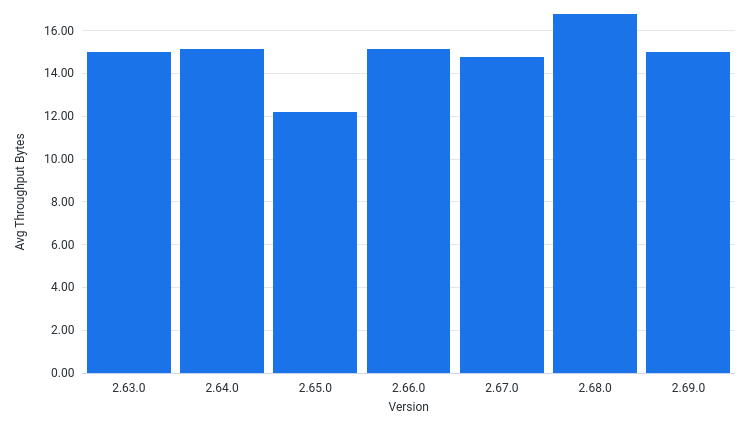
How has various metrics changed when running the pipeline for different Beam SDK versions?
AvgThroughputBytesPerSec by Version
AvgThroughputElementsPerSec by Version
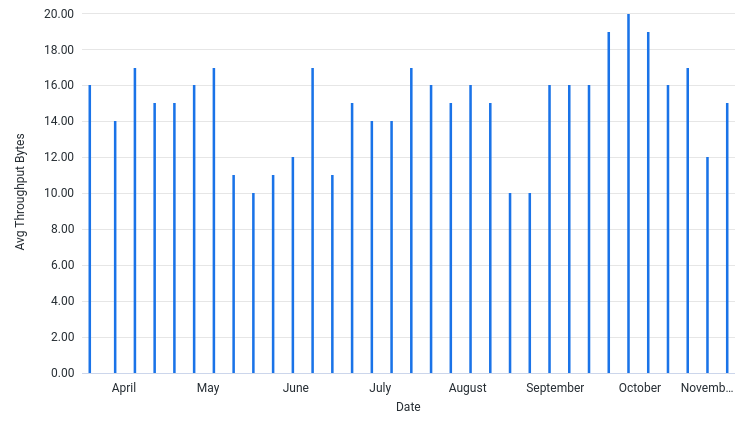
How has various metrics changed over time when running the pipeline?
AvgThroughputBytesPerSec by Date
AvgThroughputElementsPerSec by Date
Last updated on 2026/07/31
Have you found everything you were looking for?
Was it all useful and clear? Is there anything that you would like to change? Let us know!